What does it all mean? How to use culture survey data to improve your health and safety planning
Getting the most out of workforce survey data
Have you ever looked at workforce survey data and been completely bamboozled? Graphs, charts and percentages can leave you scratching your head and asking: What does it all mean?
Culture surveys can provide a wealth of valuable information about workforce attitudes and behaviours. Sifting through data and selecting what really matters for health and safety planning, however, can be a challenge. Here’s a simple guide to mining your data to unearth the gems in survey results.
• Does the response rate give you confidence about the data?
• How do we know whether the results are good or bad?
• How do you prioritise for action planning?
• Where do we target resources?
• What does the comments section reveal about the survey data?
• How do you tell real significance from statistical significance?
Was everybody onboard for this?
Thinking about response rates
Your first point of reference should be the response rate. How many people responded and how representative are they? This provides an indication of the reliability of the survey results and, crucially, the level of engagement achieved by the survey process.
The average response rate for employee surveys is around 34%, but how reliable are decisions predicated on the opinions of only one third of the workforce were engaged? Safety Diagnostics surveys achieve response rates on average around 85%.
Of course, sampling can be used in surveys, but if so, it’s important to understand what criteria were used for the sample – it’s very difficult to select a sample using more than one factor.
But how are we really doing?
Using a robust benchmark
How do you decide whether your 63% satisfaction rating is a good or bad thing?
Context is crucial to interpreting data. In an ideal world culture surveys show progress over time, but if this is the baseline survey for your project or business, specialist research consultants can provide an industry average for comparison. Safety Diagnostics, for example, has a databank of over 60,000 cases to benchmark clients against, offering essential context to survey results.
It is also possible to share and compare data with other parts of your organisation or across larger projects (major projects usually hold project-wide data).
Where do I start…?
Ranking responses
Okay, so having decided that your survey is reliable and that it bears comparison with other benchmarks, how do you decide which issues to tackle first? What really matters to your workforce?
You can’t tackle all issues at once so there has to be some way of prioritising survey results to develop into action planning. Instinctively, your eye may be drawn the areas where you appear to be doing well.
For example, here are the three highest ranked ‘Really good’ workplace factors from Safety Diagnostics data.
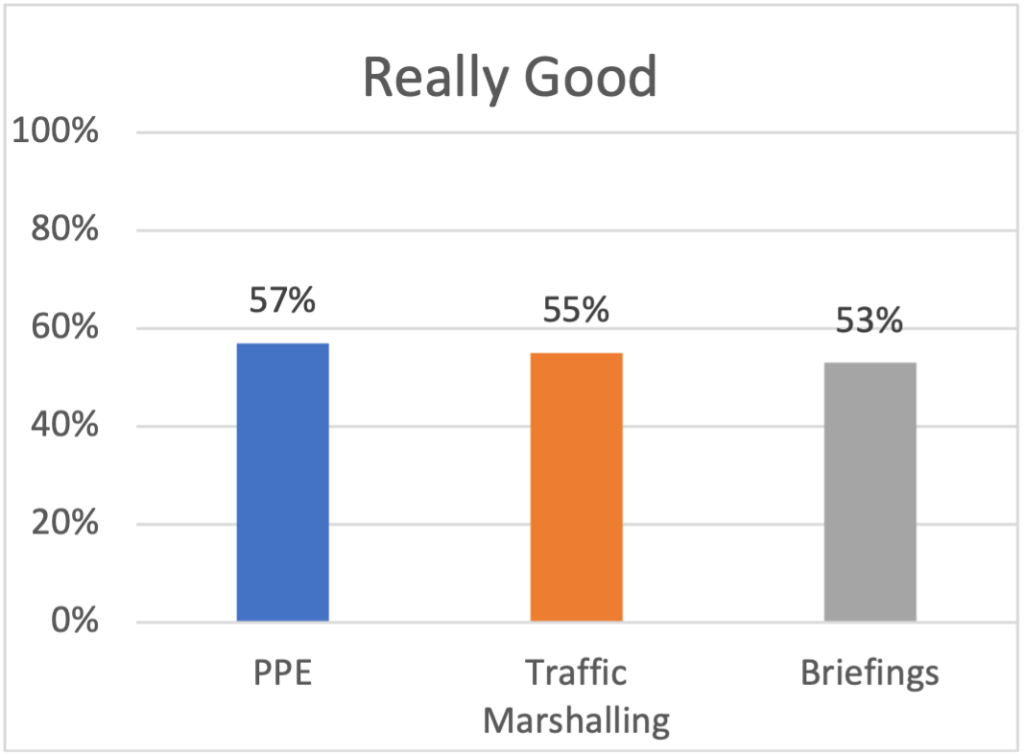
While it’s good to celebrate the issues that the project/business is already getting right, it doesn’t indicate where to expend scarce resources. In fact, if you are planning health and safety on a limited budget, looking at the areas where you are already winning is a good pointer on where NOT to spend your budget.
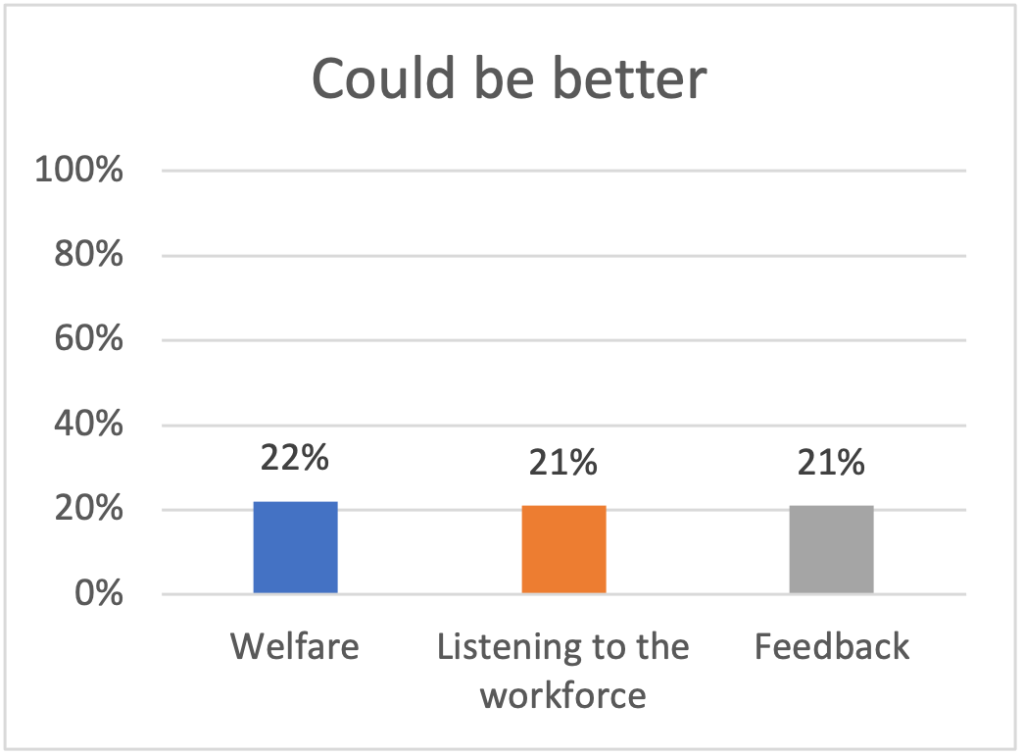
The call to action in culture survey data comes from issues that the workforce report as less favourable. The chart above shows the three most frequently cited ‘Could be better’ factors in Safety Diagnostics culture surveys. Of course, your survey might yield a different set of outcomes. But, using this data as an example, it points to where the groundwork needs to be done.
Evidence from Safety Diagnostics surveys demonstrates that welfare is a critical factor: the workforce will not be receptive to new ideas or ways of working until their basic hygiene needs are met.
Does it really matter?
Corroborating outcomes
Congratulations! You found the top three areas demanding immediate attention. But how do you know if these issues are both urgent and important?
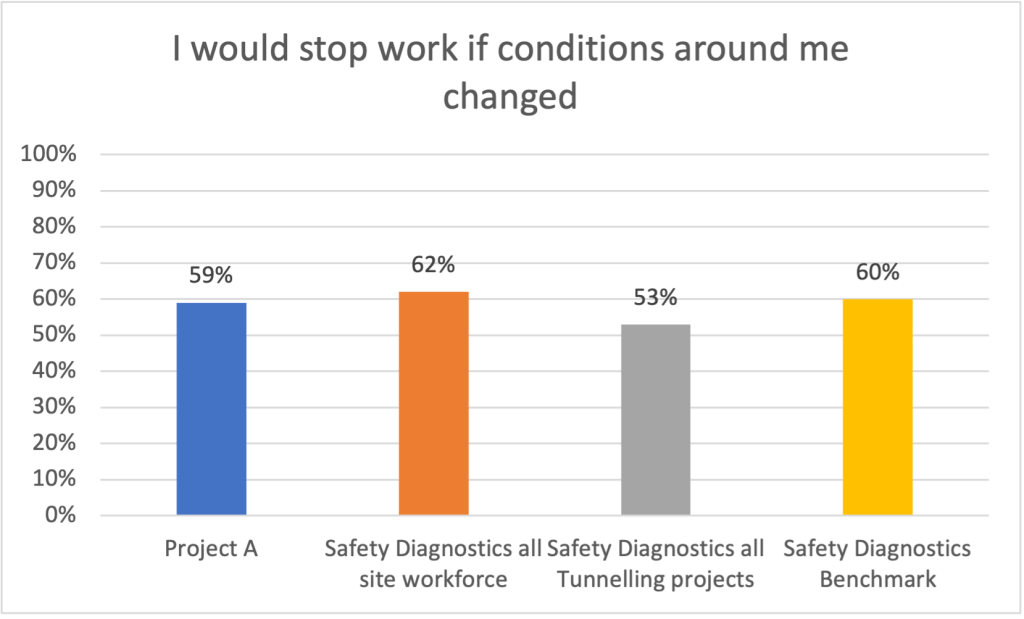
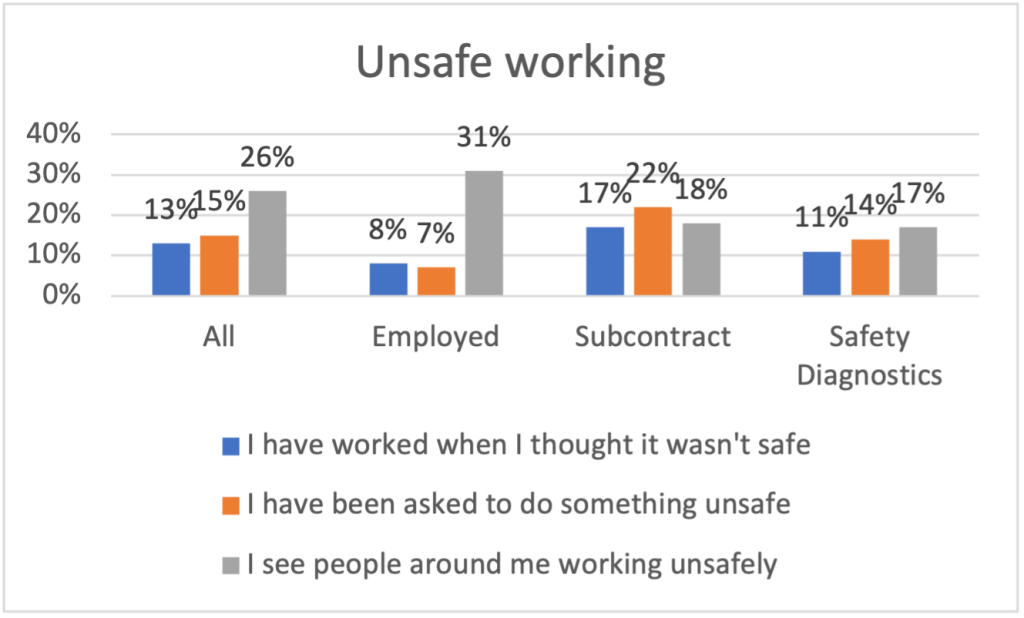
Surveys throw up a range of problems demanding attention, but before committing to an action plan, how do you know if this is a pervasive problem, or caused by circumstances prevailing at the time the survey was conducted? If an issue is having a widespread impact, there is likely to be corroboration within the body of culture survey data. Well-designed surveys probe the same issues in different ways to provide a multidimensional view of key areas. Here is an example looking at unsafe working from the Safety Diagnostics dataset:
Everything, everywhere, all at once?
Segmenting the population for cost-effective planning
Surveys can help to eliminate a scattergun approach by providing focus to health and safety issues. This involves taking an in-depth analysis of the data to compare different groups of respondents resulting in more detailed evidence for action.
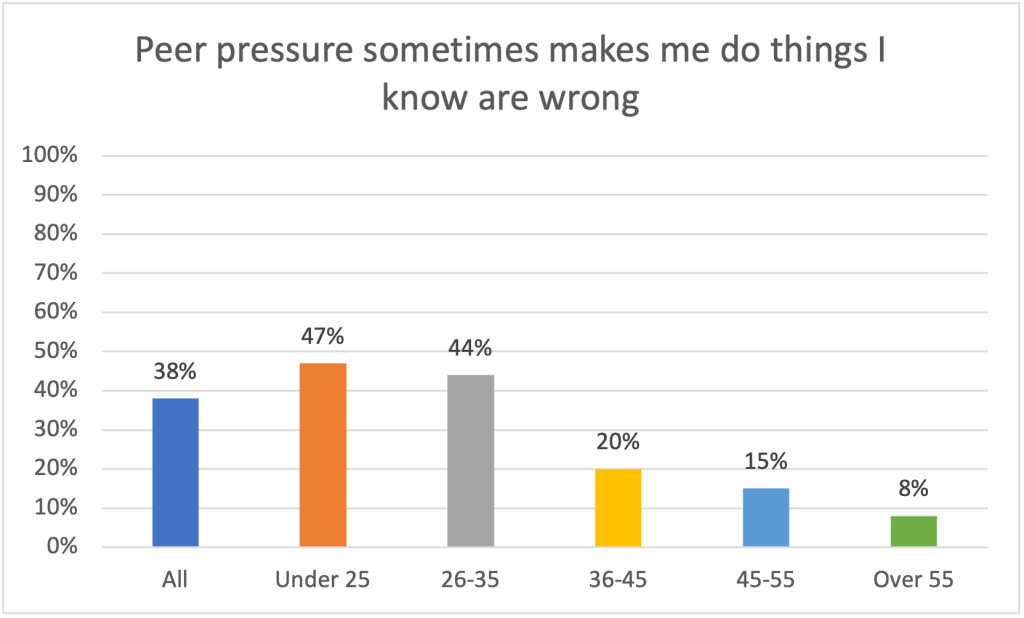
For example, compare how responses to a question about attitude to peer influence differs by age. In the chart below, drawn from a Safety Diagnostics case study, a deeper dive reveals that while just over a third of the workforce agree, those under 35 years old, are much more likely to behave badly as a result of peer pressure than their older workmates. Not only can you target behavioural inputs to where they are most needed, you might also think creatively about how to transfer the positive attributes of the older population to their younger colleagues via mentoring.
Speak to me
Free text comments
The comments section of any survey is a rich source of information and something of a bonus in an otherwise quantitative process. The text submissions can add illumination to issues arising from the survey data or introduce entirely new issues.
Observing the proportion or respondents contributing a comment provides an insight into engagement. Safety Diagnostics surveys average around 30% of respondents contributing a comment.

Comments give you a good sense of what issues are exercising the minds of the workforce at the time of the survey. If basic needs are not being met then PPE, welfare and working conditions may dominate the comments.
There are several text analysing software solutions out there, but nothing beats reading through the comments and thinking about what comes through in the context of the questionnaire responses. The comments section can add colour and detail to the data.
The comments are also really useful when giving feedback to the people who took part in the survey. Hearing or seeing their own words reflected back is a powerful indication that their concerns have been heard.
Real significance vs statistical significance
Finally, it goes without saying that all survey results need to be interpreted through the lens of practical experience and knowledge.
Surveys can throw up ‘outliers’: unexpected results that seem out of kilter with rest of the outcomes and the experiences of people working day to day in the project. This might point to a serious undetected problem, but it might also just be an anomaly.
Using corroboration will help to flush out outliers, but ultimately looking at survey results through the lens of your own experience, judgment and common sense is critical.
In summary:
• Decide how reliable the data is by thinking about who responded and how representative they are of the population.
• Determine how well your project or business is performing by using some form of external benchmark
• Find out what matters most to the workforce by looking at the lowest levels of satisfaction
• Pick off the top issues – you can’t tackle everything at once
• Validate your choice of issue by looking for corroboration in the data
• Use free text comments to add valuable detail to issues – or to raise concerns that you didn’t know about
• Finally use your knowledge, experience and common sense to judge whether issues that are statistically significant are also significant in real life